P10003 [CTT Mutual Test 2023] Fourier and the Transportation System
Background
Fourier has been promoted to the Minister of Transportation of Paris. As a new official eager to make changes, Fourier decides to rebuild Paris’s transportation system.
Description
The map of Paris can be viewed as an infinite 2D plane. Fourier has built $n$ conveyor belts on it: the $i$-th conveyor belt is built in the region $x\in[p_{i-1},p_i),y\in\mathbb R$. For the parts with $x
Input Format
The first line contains three integers $n,q,V$, representing the number of conveyor belts, the number of queries, and the person’s moving speed.
The next line contains $n+1$ integers $p_0,p_1,\dots,p_n$, describing the boundary information of the conveyor belts.
The next line contains $n$ integers $v_1,v_2,\dots,v_n$, describing the speed of each conveyor belt.
Then follow $q$ lines. Each line contains four integers $x_1,y_1,x_2,y_2$, representing the start and end points of the query.
Output Format
For each query, output one real number per line, representing the minimum time needed for this movement, in seconds. You need to ensure that the relative or absolute error compared to the standard answer does not exceed $10^{-5}$.
- If you suspect that there is a large precision error in your code, you may try to use more integers and fractions to avoid floating-point operations, thereby reducing errors.
Explanation/Hint
For Samples #4 and #5, see the attachment.
------------
Explanation for Sample #1:
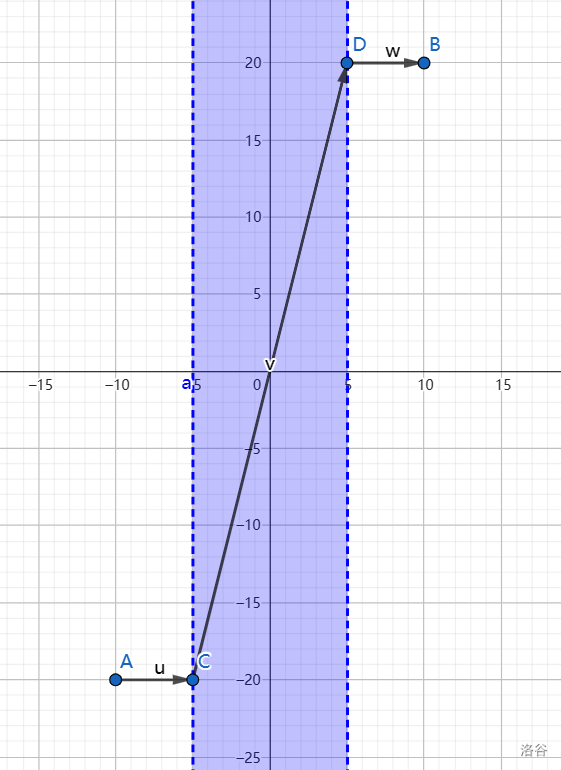
In the first query, the figure above shows a near-optimal way of walking. The blue area is the region with a conveyor belt; while on it, we move at a speed of $(3,12)$ per second (where the person’s own movement speed is $(3,7)$, meaning that it can be seen as spending 30% of the time moving along the positive $x$-axis direction and 70% of the time moving along the positive $y$-axis direction. By switching continuously within extremely short time intervals, you can achieve the diagonal movement shown in the figure. The person’s own walking $(3,7)$ and the conveyor belt’s operation $(0,5)$ add up to the velocity vector $(3,12)$).
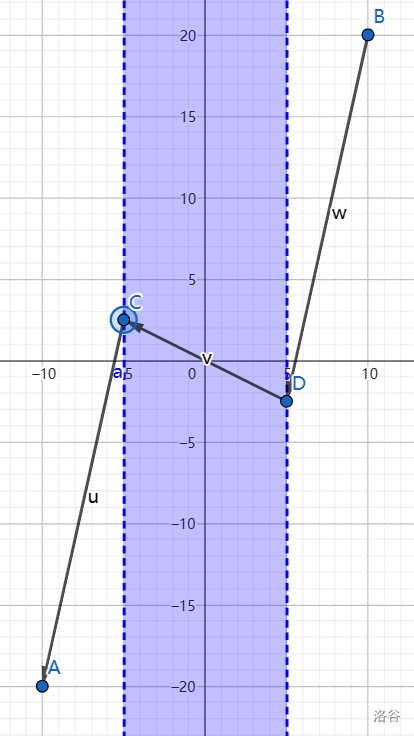
In the second query, the figure above shows a near-optimal walking plan.
Note that, in these two queries, the walking plan that achieves the minimum time is not unique; there are more than the two shown in the figures.
For all testdata, it holds that $n,q\leq1.5\times10^5$, $-5\times10^5\leq p_0