P16838 [GKS 2021 #A] L Shaped Plots
Description
Given a grid of $R$ rows and $C$ columns each cell in the grid is either $0$ or $1$.
A segment is a nonempty sequence of consecutive cells such that all cells are in the same row or the same column. We define the length of a segment as number of cells in the sequence.
A segment is called "good" if all the cells in the segment contain only $1$s.
An "L-shape" is defined as an unordered pair of segments, which has all the following properties:
- Each of the segments must be a "good" segment.
- The two segments must be perpendicular to each other.
- The segments must share one cell that is an endpoint of both segments.
- Segments must have length at least $2$.
- The length of the longer segment is twice the length of the shorter segment.
We need to count the number of L-shapes in the grid.
Below you can find two examples of correct L-shapes,
:::align{center}
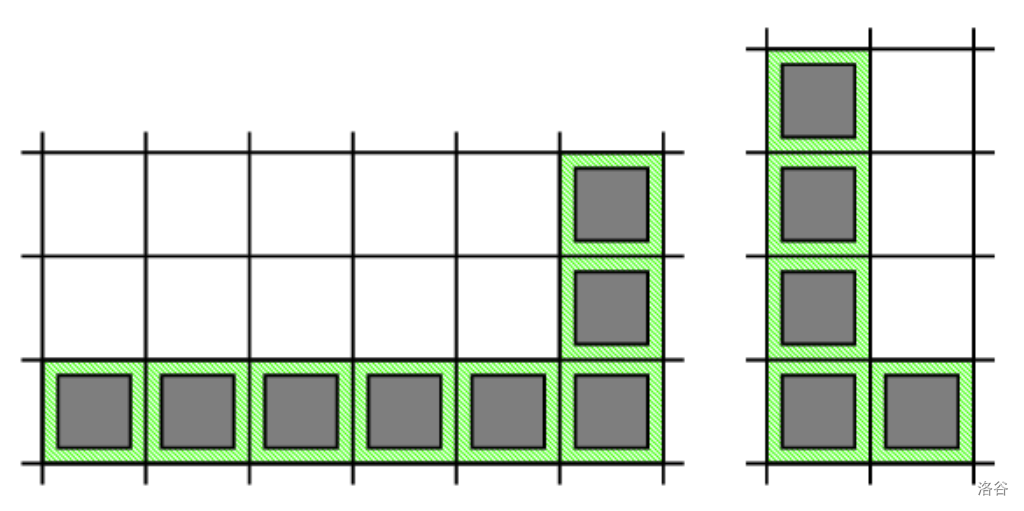
:::
and three examples of **invalid** L-shapes.
:::align{center}
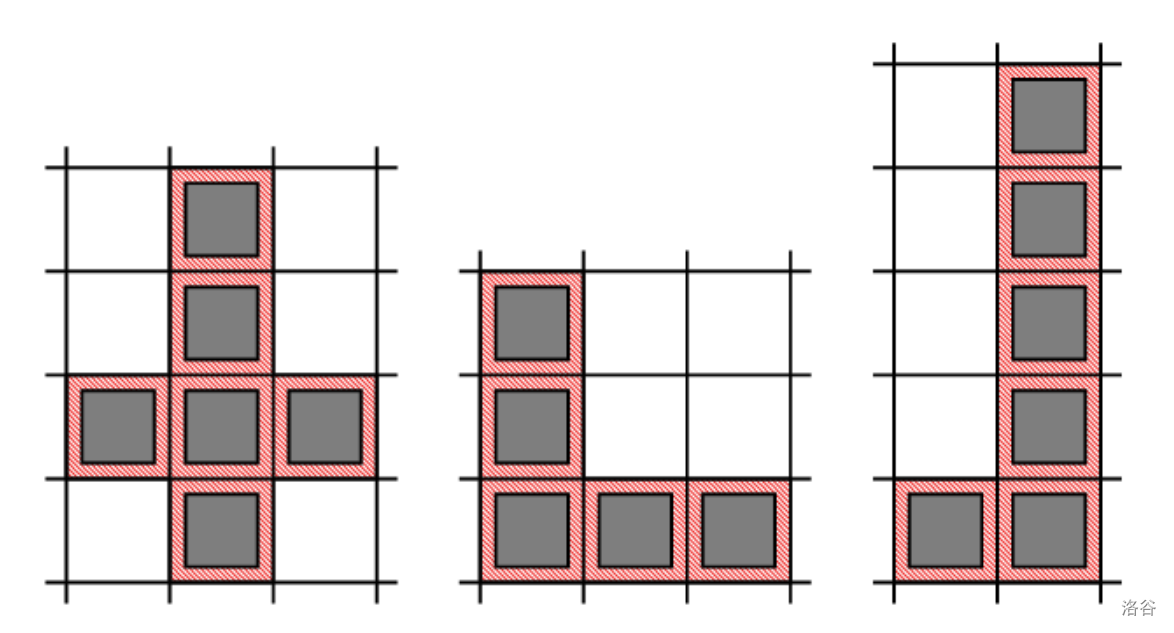
:::
Note that in the shape on the left, $2$ segments do not share a common endpoint. The next $2$ shapes do not meet the last requirement, as in the middle shape both segments have the same length, and in the last shape the longer segment is longer than twice the length of the shorter one.
Input Format
The first line of the input contains the number of test cases, $T$. $T$ test cases follow.
The first line of each testcase contains two integers $R$ and $C$.
Then, $R$ lines follow, each line with $C$ integers representing the cells of the grid.
Output Format
For each test case, output one line containing Case #$x$: $y$, where $x$ is the test case number (starting from $1$) and $y$ is the number of L-shapes.
Explanation/Hint
In Sample Case #$1$, there is $1$ L-shape.
- The $1$st one is formed by using cells: $(1,1), (2,1), (3,1), (4,1), (4,2)$
:::align{center}
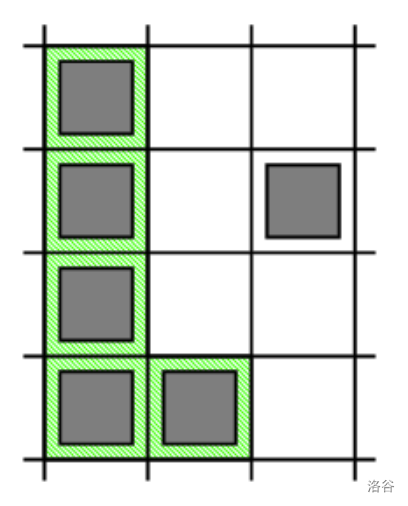
:::
In Sample Case #$2$, there are $9$ L-shapes.
- The $1$st one is formed by using cells: $(1,1), (2,1), (3,1), (4,1), (5,1), (6,1), (6,2), (6,3)$
- The $2$nd one is formed by using cells: $(3,1), (4,1), (5,1), (6,1), (6,2)$
- The $3$rd one is formed by using cells: $(6,1), (5,1), (4,1), (3,1), (3,2)$
- The $4$th one is formed by using cells: $(3,3), (4,3), (5,3), (6,3), (6,2)$
- The $5$th one is formed by using cells: $(6,3), (5,3), (4,3), (3,3), (3,2)$
- The $6$th one is formed by using cells: $(3,1), (3,2), (3,3), (3,4), (2,4)$
- The $7$th one is formed by using cells: $(3,4), (3,3), (3,2), (3,1), (2,1)$
- The $8$th one is formed by using cells: $(3,4), (3,3), (3,2), (3,1), (4,1)$
- The $9$th one is formed by using cells: $(6,3), (5,3), (4,3), (3,3), (3,4)$
The $1$st $3$ L-shapes are shown on the picture below.
:::align{center}
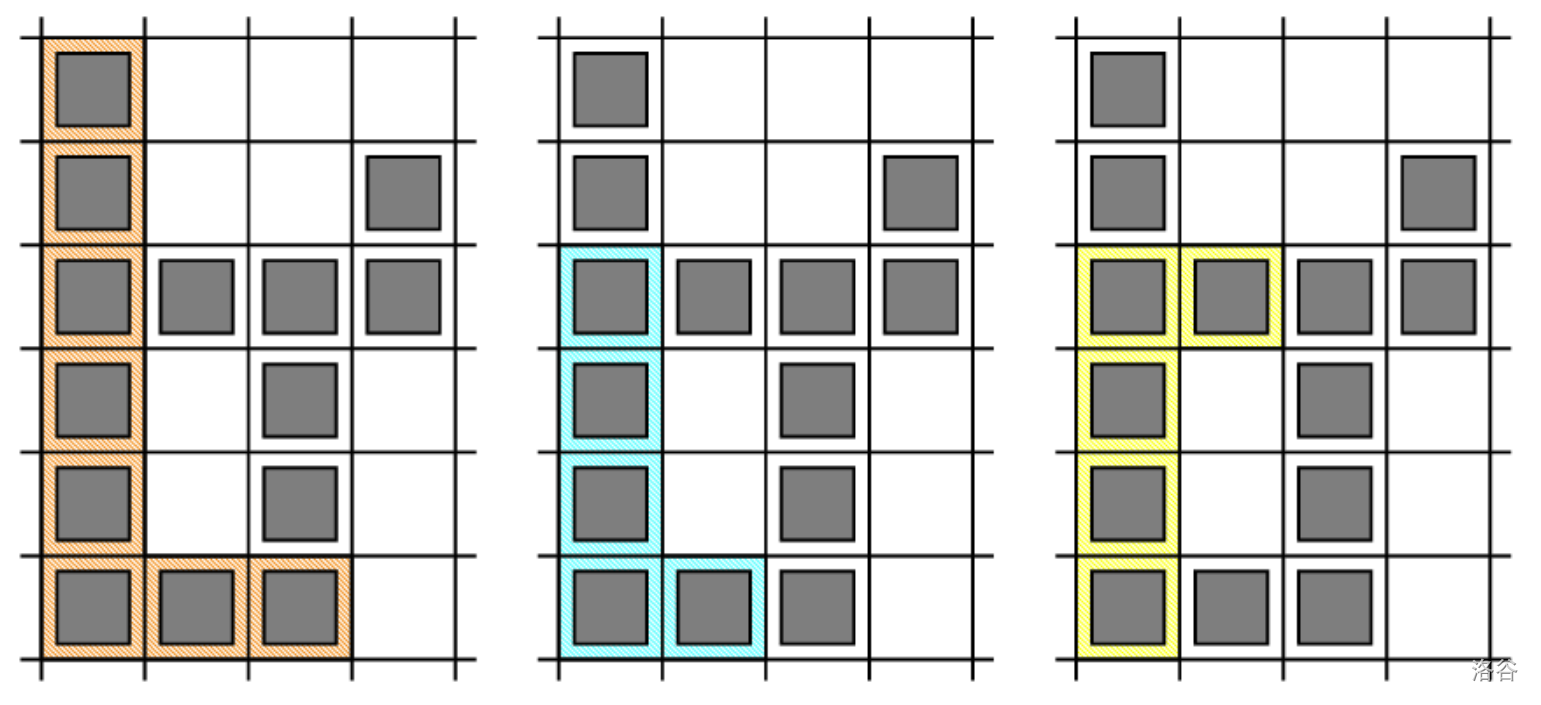
:::
### Limits
$1 \le T \le 100$.
Grid consists of $0$s and $1$s only.
**Test Set $1$**
$1 \le R \le 40$.
$1 \le C \le 40$.
**Test Set $2$**
$1 \le R \le 1000$ and $1 \le C \le 1000$ for at most $5$ test cases.
For the remaining cases, $1 \le R \le 40$ and $1 \le C \le 40$.